Statistics and Valuation Ratios#
This Data Bundle provides company statistics such as EBITDA, ratios, and other key financial data.
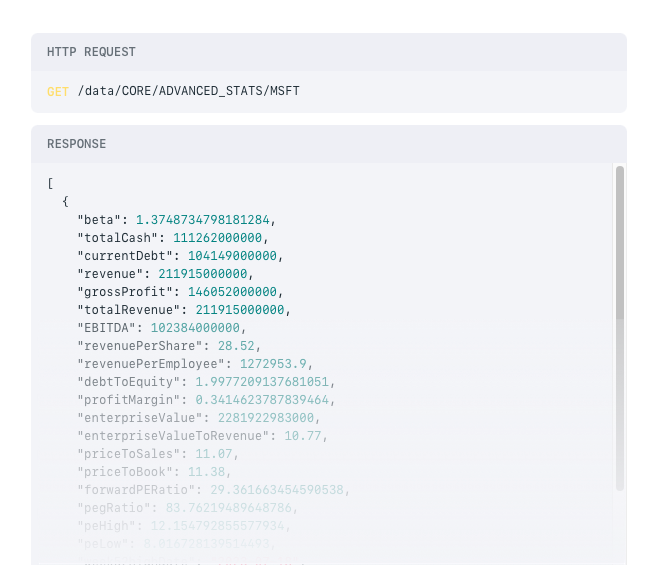
The following image shows response data from the bundle’s Statistics & Valuation Ratios endpoint.
Tip
Purchase this bundle in the Console.
Endpoints#
Statistics & Valuation Ratios - Key statistical information about a company including EBITDA, ratios, key financial data, and more.
Rule Event Facts#
DEPRECATED
Apperate and its features (including this feature) are deprecated.
Create rules that filter on the following facts.
Fact |
Description |
---|---|
Beta |
Beta is a measure used in fundamental analysis to determine the volatility of an asset or portfolio in relation to the overall market. Levered beta calculated with 1 year historical data and compared to SPY. |
Total Cash |
Cash on hand |
5 Day Change % |
Price percent change based on calendar days |
52 Week Change % |
Price change based over the last 52 calendar weeks |
2 Year Change % |
Price percent change based on calendar days |
5 Year Change % |
Price percent change based on calendar days |
Current Debt |
Current debt of the company |
Debt to Equity |
The debt-to-equity (D/E) ratio is calculated by dividing the total liabilities of a company by its shareholder equity |
Dividend Rate |
Trailing twelve month dividend rate per share |
Dividend Yield |
The ratio of trailing twelve month dividend compared to the previous day close price. The dividend yield is represented as a percentage calculated as (ttmDividendRate) / (previous day close price). Investopedia |
Next Dividend |
Announced ex date of the next dividend |
Next Earnings |
Announced next earnings report date |
EBITDA |
Earnings before interest, tax, depreciation and amortization from the most recent quarterly financial report |
Enterprise Value |
Enterprise value (EV) is a measure of the total value of a company. It is often used as a more comprehensive alternative to equity market capitalization. |
Enterprise Value to Revenue |
The enterprise value-to-revenue multiple (EV/R) is a measure of the value of a stock that compares the enterprise value of a company to its revenue. |
ExDividend Date |
Ex date of the last dividend |
Float |
Returns |
52 Week High |
Highest fully adjusted price observed during trading hours over the past 52 calendar weeks |
52 Week Low |
Lowest fully adjusted price observed during trading hours over the past 52 calendar weeks |
30 Day Average Price |
Average price over the last 30 calendar days |
30 Day Average Price Standard Deviation |
Average price standard deviation over the last 30 calendar days |
30 Day Average Price 2x Standard Deviation |
Average price 2x standard deviation over the last 30 calendar days |
50 Day Moving Average |
Based on calendar days |
200 Day Moving Average |
Based on calendar days |
Forward PE |
Forward price-to-earnings (forward P/E) is a version of the ratio of price-to-earnings (P/E) that uses forecasted earnings for the P/E calculation |
PEG Ratio |
The PEG ratio is calculated easily and represents the ratio of the P/E to the trailing twelve month (ttm) earnings per share (EPS) growth rate of the company |
Price to Book |
The price-to-book ratio, or P/B ratio, is a financial ratio used to compare the current market price of a company to its book value |
Price to Sales |
Price-sales ratio, P/S ratio, or PSR, is a valuation metric for stocks. It is calculated by dividing the market capitalization of the company by the revenue in the most recent year; or, equivalently, divide the per-share stock price by the per-share revenue. |
Profit Margin |
A measure of profitability by finding the net profit as a percentage of the revenue. |
Revenue |
In accounting, revenue is the income that a business has from its normal business activities, usually from the sale of goods and services to customers. |
Revenue per employee |
Net Income per employee (NIPE) is the net income of the company divided by its number of employees. |
Revenue per share |
Amount of revenue over common shares outstanding. |
Total Revenue |
Calculated as the sum of gross income (the difference between sales or revenues and cost of goods sold and depreciation) and cost of goods sold for the period. |
Sector Change % |
The corresponding sector’s price percent change. |
Stock vs Sector Change % |
The stock price percent change minus the corresponding sector’s price percent change. |
Shares Outstanding |
Number of shares outstanding as the difference between issued shares and treasury shares. Investopedia |
30 Day Average Volume |
Average volume over the last 30 calendar days |
30 Day Average Volume Standard Deviation |
Average volume standard deviation over the last 30 calendar days |
30 Day Average Volume 2x Standard Deviation |
Average volume 2x standard deviation over the last 30 calendar days |
See also
See also the Commonly Available Rule Event Facts.